

Engine design has changed a great deal since the Model T. Forced induction in 1920s increased engine power without increasing the size; fuel injection in the 1980s increased fuel efficiency and made carburettors a thing of the past; and more recently, the introduction of hybrid engines has massively reduced CO2 emissions.
This blog post looks at how engines have changed over the past 30 years and how they have been affected by regulatory, technological and consumer demand changes.
1. Engine size trends
The graph below shows how the distribution of new vehicle engine sizes has changed each year since 1980.
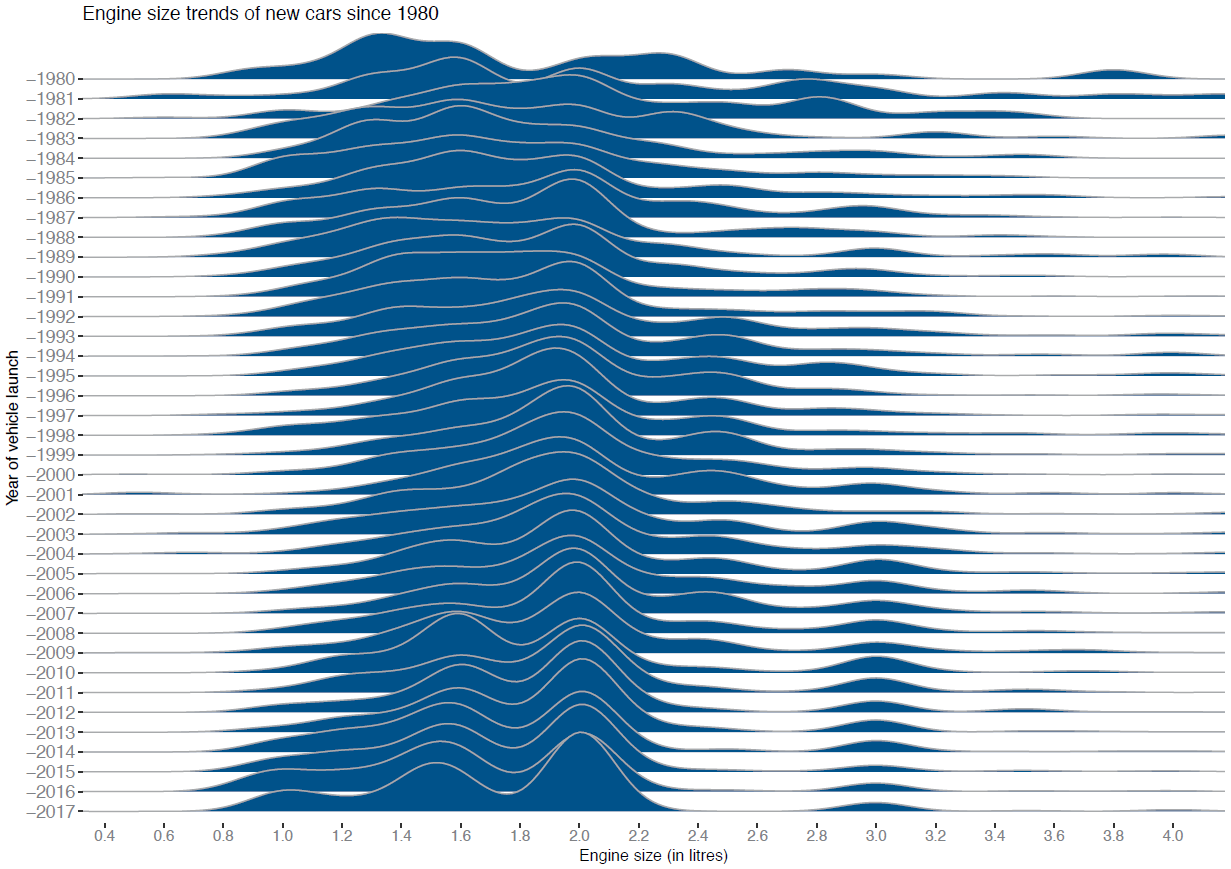
The vertical axis shows the year each new vehicle type (CAP ID) was launched. The horizontal axis shows the engine size of the vehicle. The proportion of vehicles launched each year for each engine size is represented by the blue, bumpy shape. The larger the bump, the greater the proportion of vehicles with that engine size were launched that year. Let’s use 1980 as an example.
We can see from the shape of the bump that the majority of vehicles launched in 1980 had engine sizes between 1.1 litres and 1.6 litres; with the most popular engine size in the middle at 1.3 litres. There is another, smaller ‘bump’ between 2.0 and 2.4 litres and a small proportion of vehicles launched at 2.7 litres and 3.8 litres.
What has happened over the last 20 years?
2.0 litre engines
In 1986, 2.0 litre engines became the most commonly produced engine size. This prevalence was sustained throughout the 1990s, 2000s and 2010s and continues today with little sign of letting up. This shouldn’t be much of a surprise: 2.0 litre engines are the mainstay in medium executive vehicles and power the majority of fleet vehicles. And unlike most engine sizes, there is a similar contribution of new vehicle launches from both diesel and petrol vehicle types.
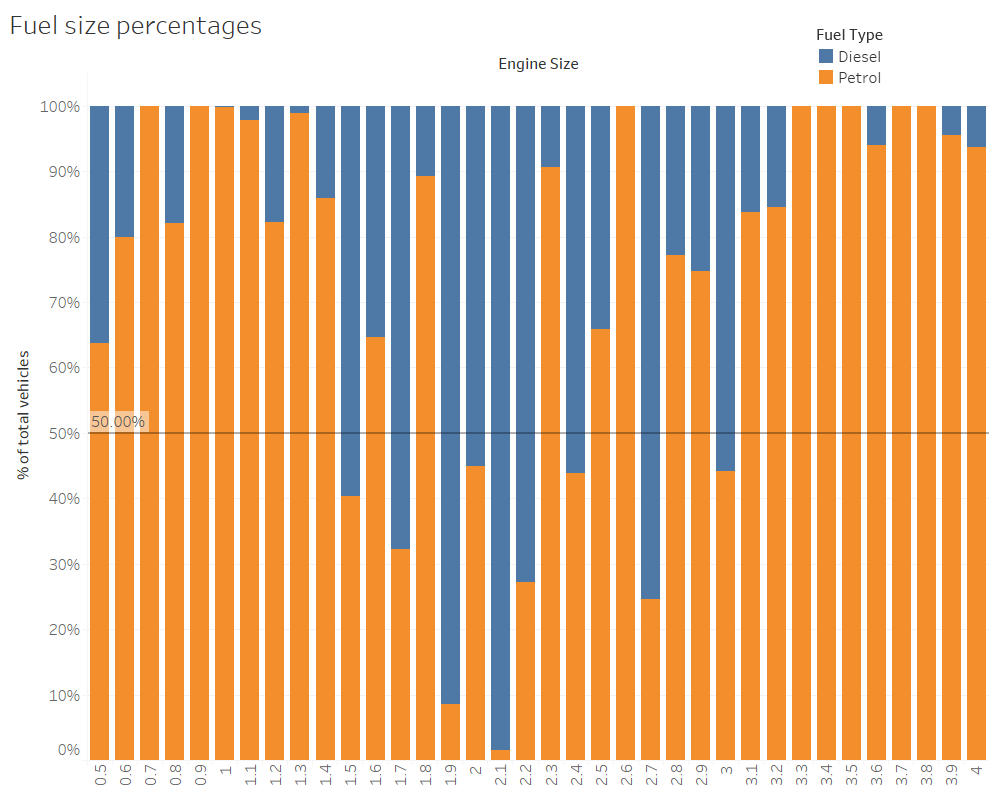 Percentage of vehicles launched per engine size by fuel type (diesel and petrol).
2.4 litre engines
From the early 1990s to the early/mid 2000s there was a decline in the relative number of vehicles launched with smaller engine sizes (less than 1.2 litres). The power produced by these engines had plateaued and perhaps become less appealing to consumers. At the same time, the 2.4 litre engine re-emerged as a prevalent engine choice in new cars. Surprisingly, almost 3/4 of all 2.4 litre vehicle types launched in the UK have been manufactured by Volvo.
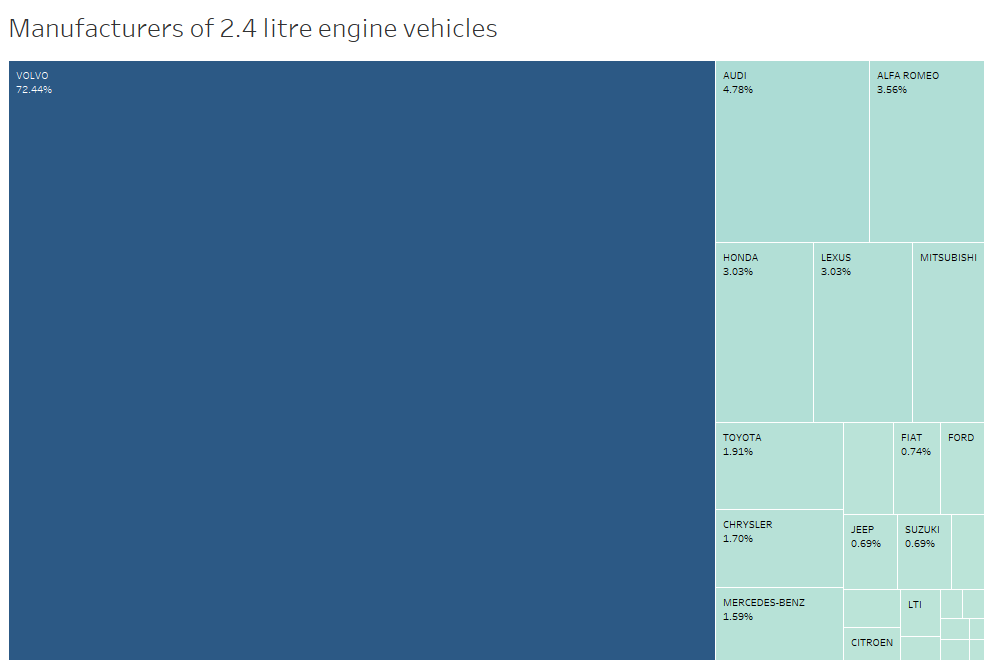 Percentage of 2.4 engine vehicles launched by manufacturer.
3.0 litre engines
There have been a relatively small number of vehicles launched each year with engine sizes between 2.4 and 3.2 litres. The early 2000s saw these types of vehicles converge at 3.0 litres. This coincided with the new generation of cleaner diesel engines.
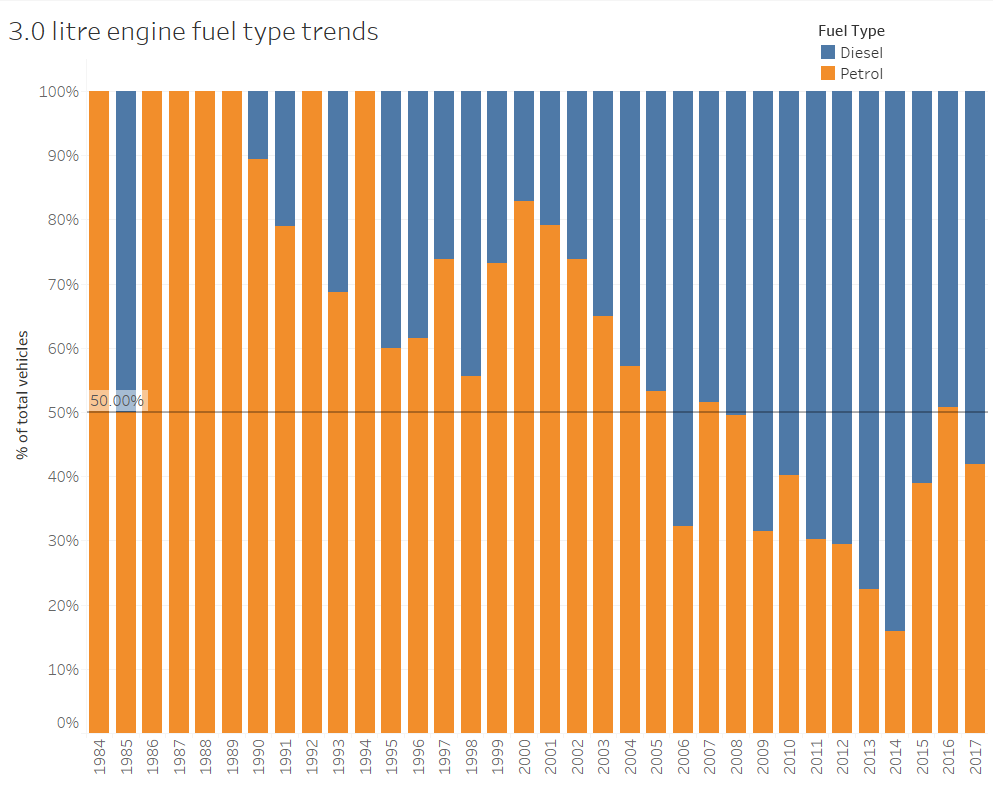 Diesel and petrol split of 3.0 litre engines launched annually.
The graph above shows the diesel (blue) and petrol (orange) percentage split of 3.0 litre engines each year from 1984 to 2017. For example, in 1993 approximately 70% of new 3.0 litre cars launched were petrol engines and 30% were diesel. In fact, the majority of pre-2004, 3.0 litre vehicles launched were petrol. Recent years have seen this trend turned on its head.
Re-emergence of smaller engine vehicles
The mid 2000s saw the beginning of a re-emergence of smaller engine vehicles. This really gained speed in the late 2000s and early 2010s when technological advances in engine design (turbos and improved engine configuration) increased engine power.
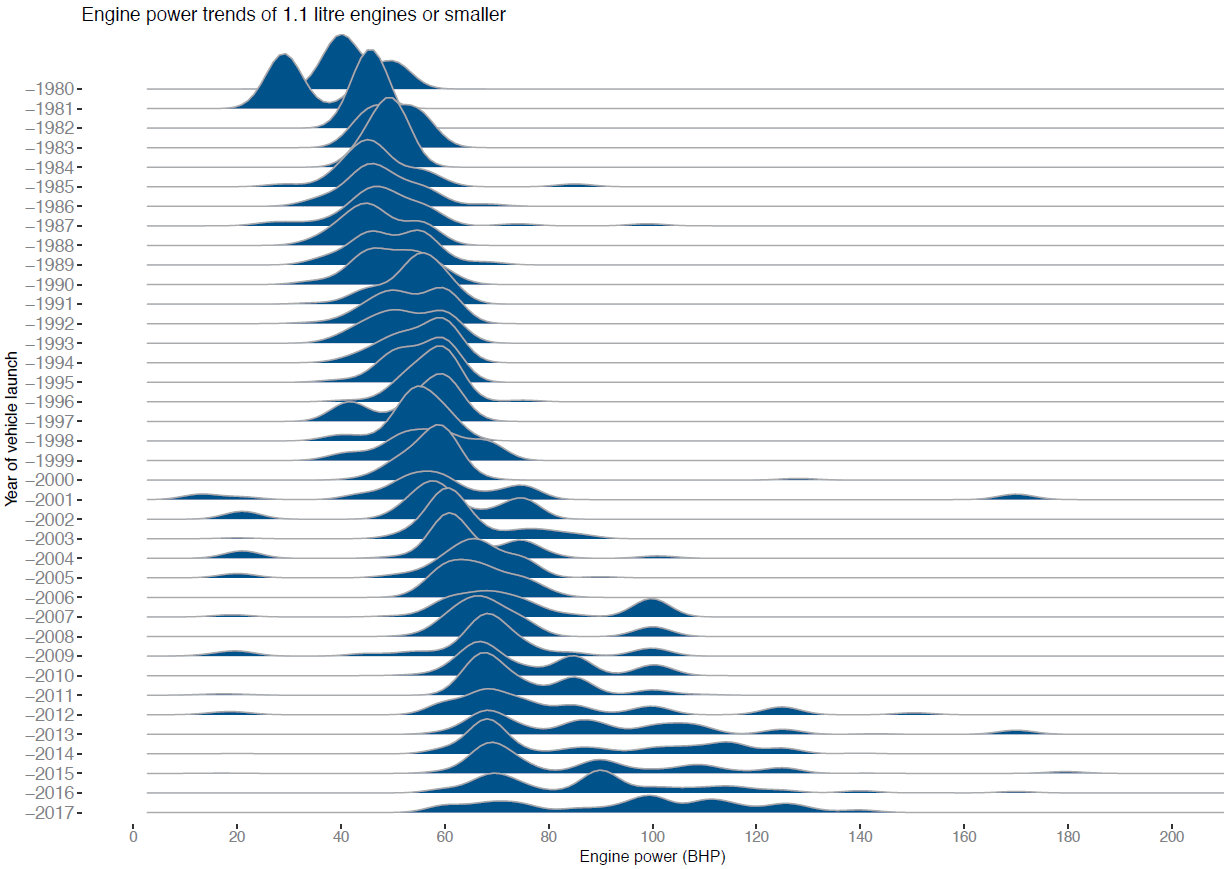 Distribution of engine power for 1.1 litre or smaller new vehicles launched each year since 1980.
From the 1980s to the early 2000s there is very little change to engine power output. Since 2001 there has been a steady increase in the power produced by these engines. The last 7 years have seen a spread of power outputs from 60 BHP to 130 BHP; over twice as powerful as the average 1980s engine.
Technology has played a huge part in these improvements; but technological improvements haven’t been limited to smaller engine sizes.
2. Fuel economy improvements
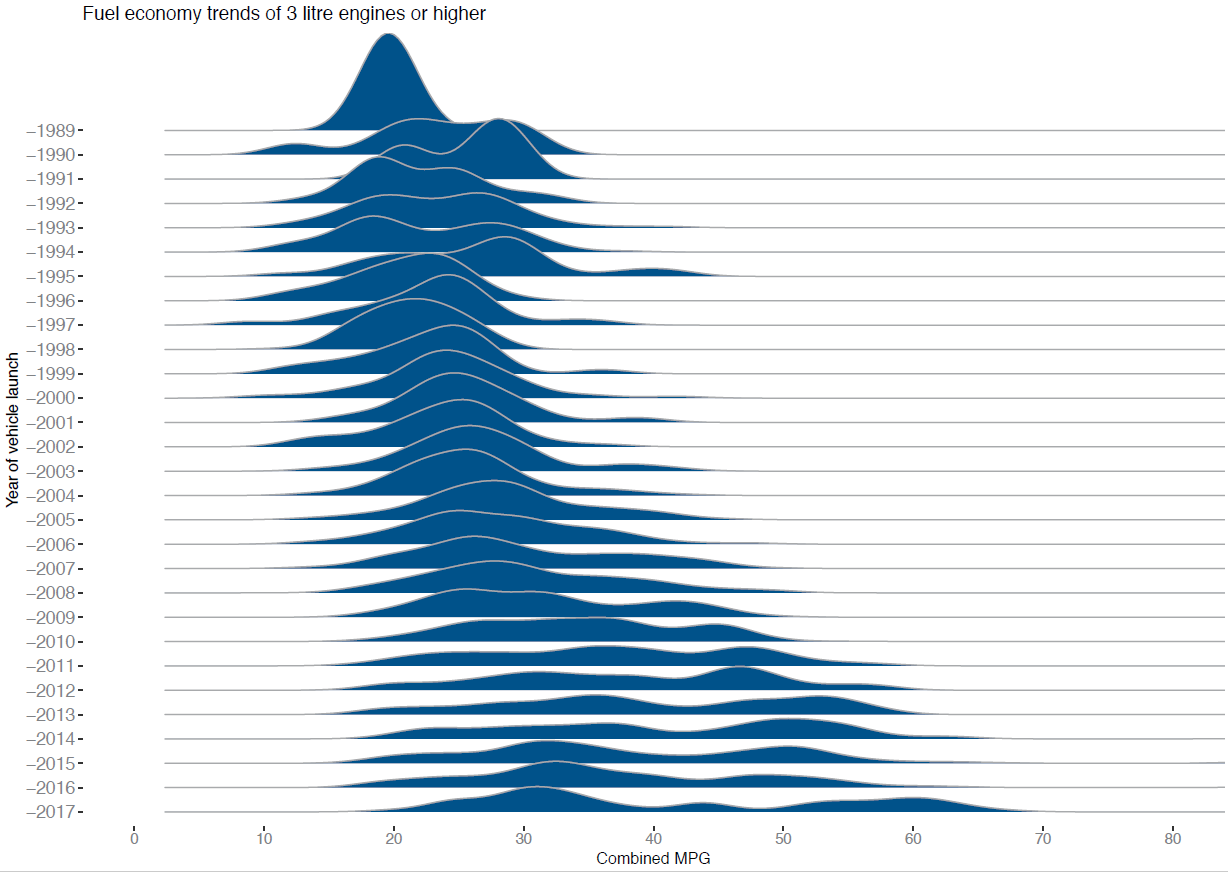 Distribution of fuel economy (MPG) of 3.0 litre engines or higher new vehicles launched since 1989. This metric wasn’t reliably recorded before 1989.
The MPG for these types of vehicles changed little up until the early 2000s. The most impressive advancements occurred after 2010 when fuel economy began to exceed 50 MPG.
3. Emission trends
Advances in technology often need an incentive. Governments can provide these in the form of grants or scrappage schemes but also by changing regulation. Since the early 2000s, there has been a big push to reduce the CO2 and Nitrogen Oxide emissions for environmental and health reasons. This has been reflected in the European emission standards and most recently the new vehicle tax regulations in the UK. Have these regulations had an effect on new vehicles?
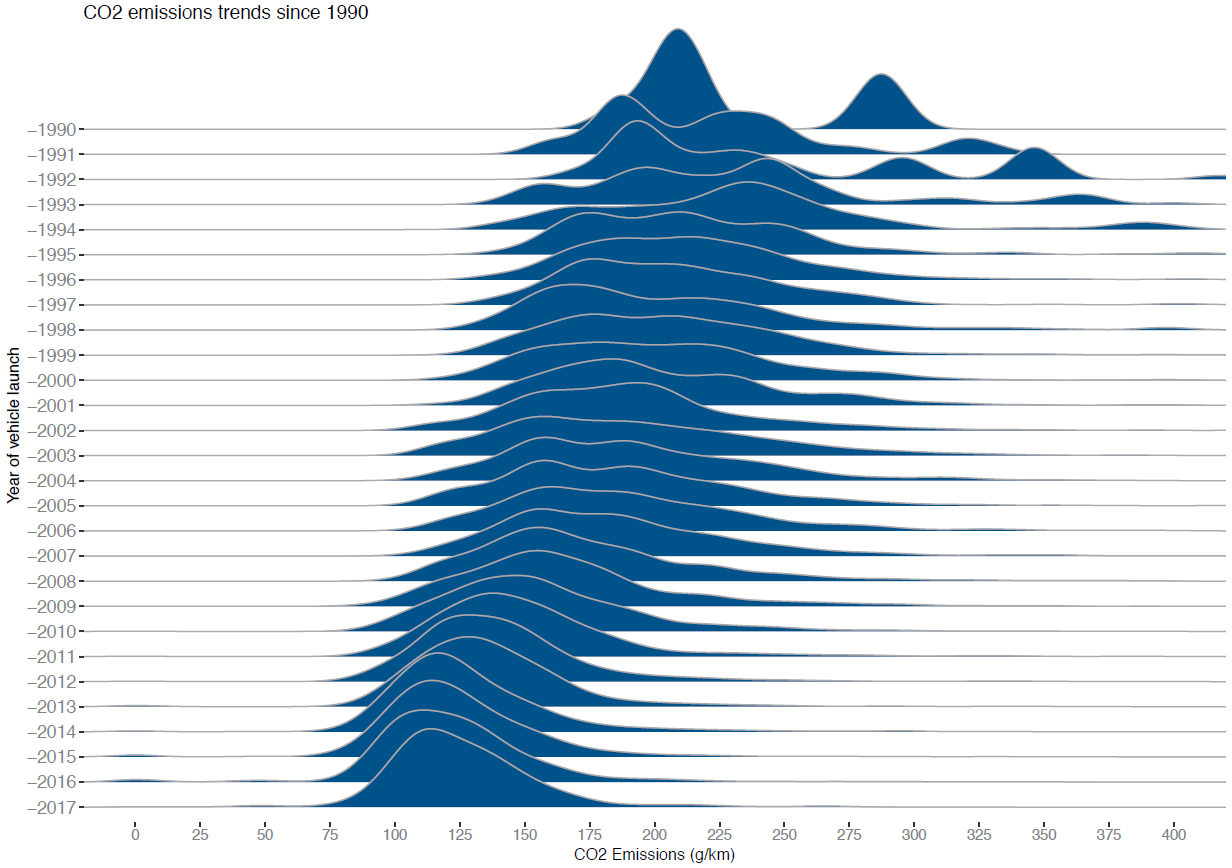 Distribution of CO2 emissions of new vehicles launched since 1990.
There is a clear reduction in the minimum CO2 emissions and the overall range of emissions from the early 1990s to 2010s. The improvements have levelled off in the last few years. Whether this is due to the limits of current technology or the limits to the current incentives is a question for another day.
What about Nitrogen Oxide emissions?
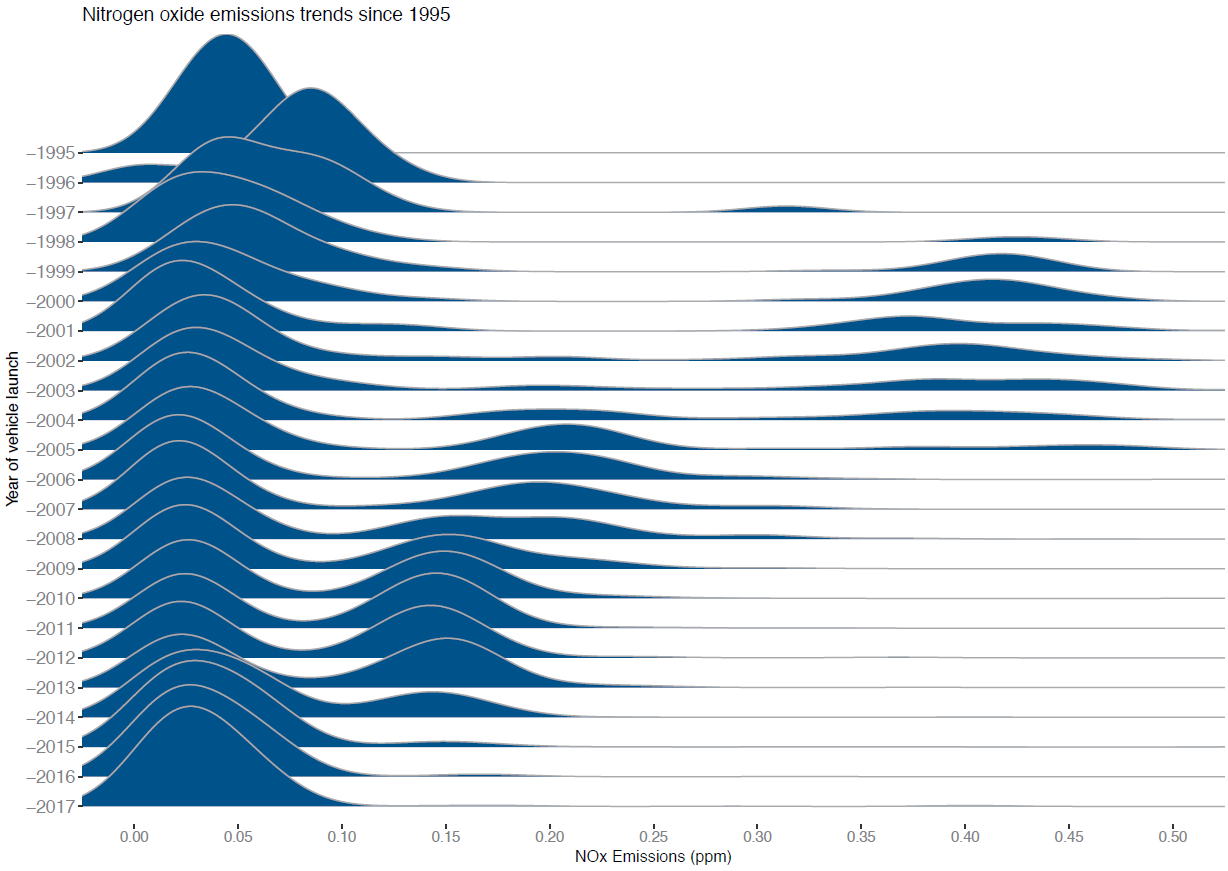 Distribution of Nitrogen Oxide emissions (measured in parts per million) of new vehicles launched since 1995.
The reductions in Nitrogen Oxide are not as dramatic as those seen in the CO2 emissions. The proportion of vehicles producing more than 0.10 ppm has reduced over the past 20 years but there has been no improvement in the average level of emissions of about 0.03 ppm. Once again, this could be due to the limits in the technology at the moment or the lack of incentives. Either way, the next few years should be interesting.
Why this matters
The combustion engine as we know it is under attack. New petrol and diesel engines will be banned in the UK from 2040 and the current specification of vehicles are facing ever increasing restrictions on their use; from additional taxation on new vehicles to additional congestion charges for heavily polluting vehicles in city centres.
These changes have sparked discussion about how these regulation changes will affect future engine design. Will hybrid vehicles become more prominent? Or will the industry/market skip this step and jump straight to electric vehicles? One thing is for certain, our reliance on cars isn’t about to change anytime soon.