
As the world accumulates data, more and more data science teams will be faced with the problem that their data no longer fits into their conventional workflow. Creating data-driven systems with hundreds of millions of rows of data requires a different set of tools to the ones statisticians, and even software developers, have been using in recent decades. How do we at Cox Automotive envisage moving from laptop-based analyses to big data systems?
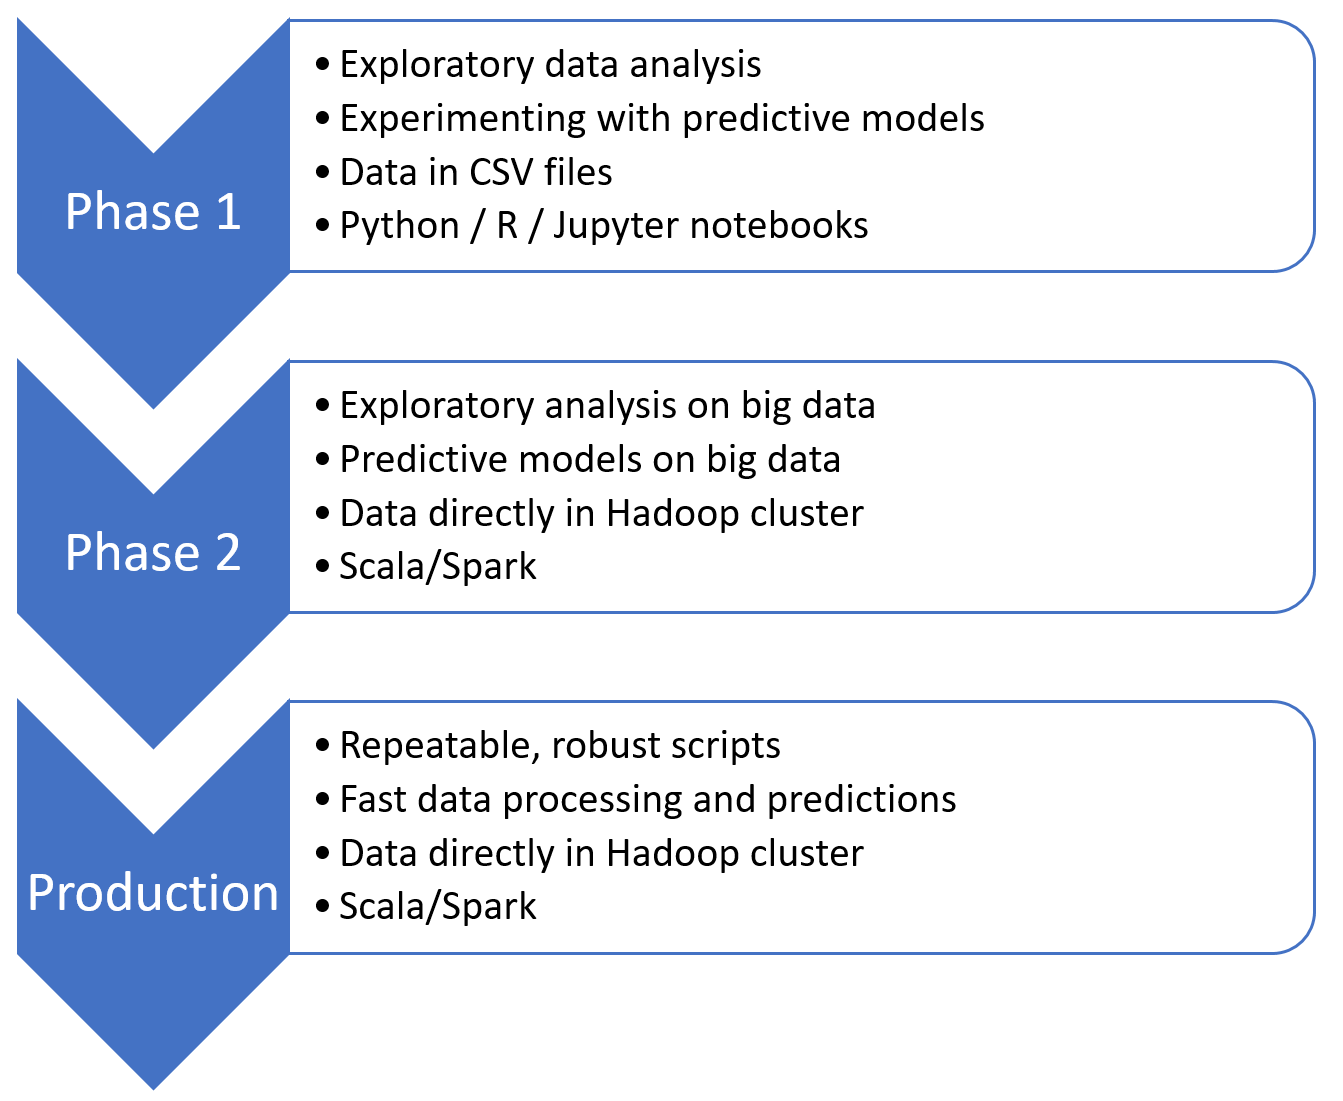
Phase 1: Starting Small
In any new data science project, you’ll likely start with exploratory data analysis. This often involves getting a data extract in a CSV file, which you load into your favourite exploratory tool (we use two of the classics: Python with Jupyter notebooks and R with RStudio). At this stage, we want to make sure that the data is adequate for the questions being asked and no big data technology is necessary. We envisage this remaining the same regardless of how big our data becomes, so this is our permanent Phase 1 of data analysis projects.
For now, our initial datasets are all CSV files, because we are still in the process of moving our data sources to a permanent home in the Hadoop cluster. Our exploratory tools are happier with CSV files than they are connecting directly to Hadoop, which is an additional reason not to change this step.
This also applies to modelling. A well-constructed data extract is good enough to start experimenting with predictive algorithms and iterate quickly, and a notebook-driven workflow is perfect for this.
Why?
This stage is pure R&D, so we want our toolset to allow deep dives into rabbit holes, while documenting our steps in a repeatable manner. Notebooks allow a unique combination of code and commentary that means we can more easily pick up each other’s work and follow each other’s thought processes. At this stage, we need to make crucial data wrangling decisions that need to be transparent if we ever need to revisit them.
The real challenge we are facing is how to move onto the dreaded(?) next step: production.
Phase 2: Scaling Up = Skilling Up?
By the time we get here, we’ve done some analysis and are confident that the data is fit for purpose and the questions are worth exploring further. We also have an idea about which algorithms will help us make useful and accurate predictions. However, we’ve only done this on a tiny subset of our multi-million row database.
How do we scale up our exploratory analysis and predictive models, and if we’re happy, deploy them to production?
We can’t connect our laptops straight to our Hadoop cluster – that’s too slow. Trust us, we’ve tried. Trying to transport large datasets over the network is almost never a good idea anyway; our data engineers kindly asked that we emphasise that. We also can’t just download a larger sample from our Hadoop cluster, because the sample we’d need to verify our findings on is too big to fit in our laptops’ memory. If it’s not, then we’re not proving anything new since Phase 1!
Why not buy off-the-shelf?
There are plenty of tools out there that promise what we’re after. They claim to be built so that you can seamlessly deploy your models into production with a single click, straight from inside your exploratory analysis. Typically, the only way to achieve this is to do Phase 1 on their terms, in their editor. The problem isn’t that these tools don’t have the necessary features to be good at Phase 1; it’s that they assume Phase 2 is simply Phase 1 on bigger hardware. In our world that’s far from the truth.
Development vs. Production – a digression
We have come to the realisation that looking for a one-size-fits-all toolset for both the R&D and production phases will leave us with too many compromises. The R&D phase requires too much ad-hoc experimentation where we need to be free of constraints, and even the thought of how our experiments would need to be deployed can distract from the iterative and exploratory nature of this phase.
The production phase requires the opposite – a rigid, robust, and scalable approach with built-in monitoring and fail-safes. We’ve summarised the key requirements for each phase below, and this is what we’d use to evaluate potential off-the-shelf tools.
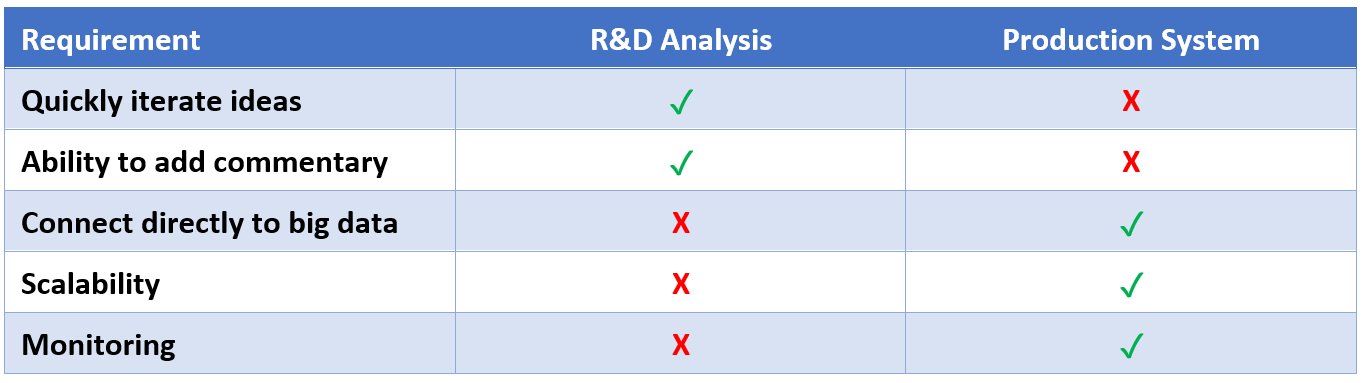
There might be a tool out there that can do all of these things adequately, but rather than spending more time chasing that unicorn we’ve instead separated the two phases once and for all.
Finding a new toolset for production
The alternative to buying off-the-shelf, which is more attractive to us for the above reasons, is to find a Hadoop cluster-friendly way to convert our notebook-based analyses into production-ready predictive systems. Unlike conventional web-based businesses, our data is not cleanly collected from a single website. It comes from many different systems and requires processing with ever-changing business rules, so we don’t think there’s a “one click deploy” method for us out there yet. We need full control of every step of the process and want to be free to choose our approach for each of them.
Our ideal pipeline, which we’re currently working out, will use Scala-Spark to make use of native speeds and parallelism on the cluster. Many predictive algorithms we require have an equivalent implementation in Spark, so at least conceptually we don’t need to rewrite our code. Scala is a general-purpose language so we can also build in our own monitoring, alerts, and so on within the same framework. Another benefit is that we can use the expertise of our data engineers to guide us in building a robust pipeline, and come to a solution built using best practices.
Conceptually our process looks and will look something like this:
Where do we go from here?
We are still on our journey to big data, and while we haven’t settled on a final solution we’ve already made some decisions along the way; the key one is that we are confident that for us R&D and deployment are two separate stages in the data product lifecycle, and we’re OK with that.